WP Table Manager: Chart From Tables
1. Create a table with data
Since version 2.0 you have now the possibility to add charts inside your content. First, create a table with data to generate a chart.
You can also select two or more separate columns using Control (Windows)/Command (Mac) to create a new chart.
Then make your selection in order to generate a chart, here all the table is selected, click on Menu Chart > Create chart from data button.
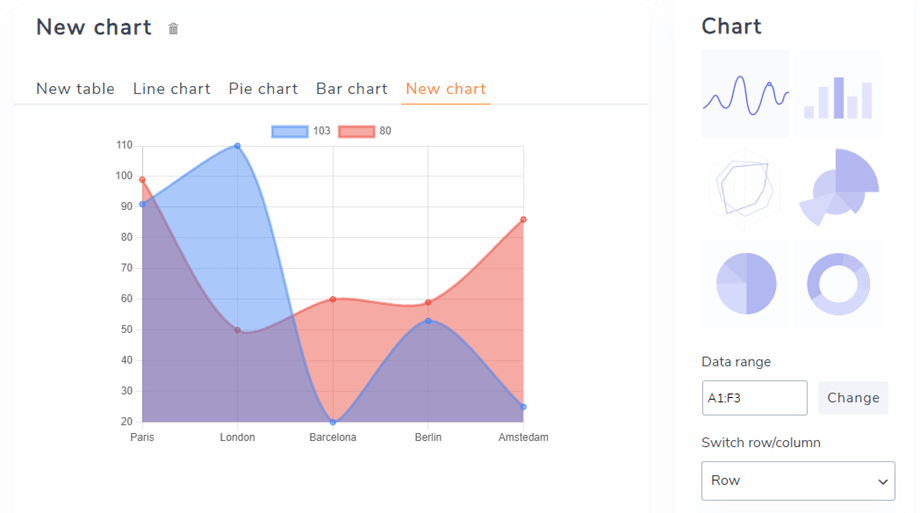
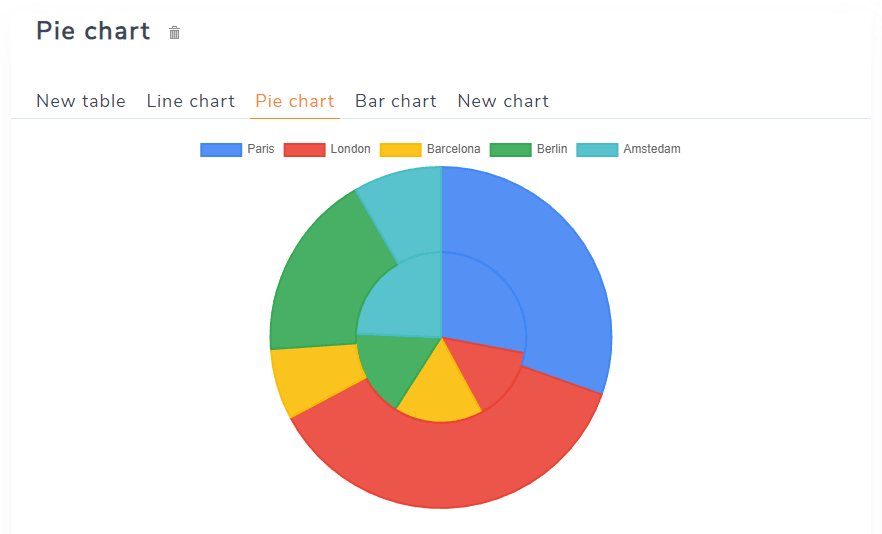
A chart will be generated, respecting the data range you’ve selected. On the right part, you can select a chart type. You can generate as graph as you need from a data set.
The graph will be dynamically updated regarding the data change in the table.
Or you can click on Menu Chart > View existing charts button if you already created charts.
2. Graph parameters
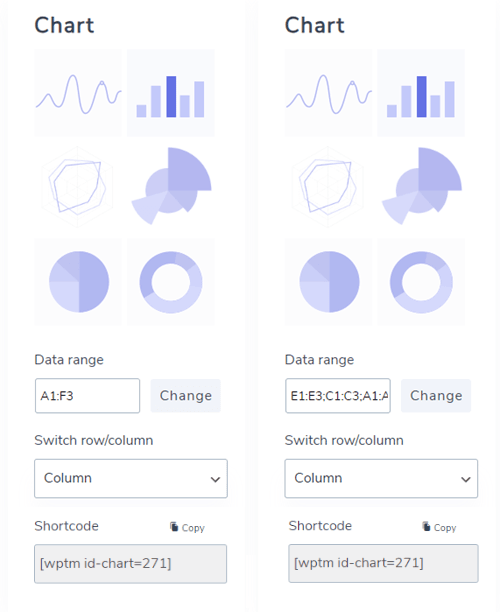
Once your graph is added you have some options on the right column.
- Chart types: 6 sample charts are included.
- Select Range: your data area on the table.
- The “Switch row/column” is only available if you have selected only numbers in the dataset. You’ll be allowed to switch data from col to row.
- Shortcode: chart shortcode you can insert in editor.
Custom axis data
In this Custom axis data section, you can select row/column following the settings above.
- Series: Select rows/columns to display
- X-axis
- Select row/column
- Use selected row/column as X-labels
- Use first row/column as chart data
- Y-axis
- Major step
- Min Value of Y-axis
Data series color
In this section, you can select colors for columns and rows.
Configuration
In the Configuration section, you can adjust some styles of the chart.
- Chart legend display: Show/hide the legend above the chart.
- Custom legend text: Edit the text of the legend.
- Chart width/Chart height: set width/height for a chart.
- Align chart: Select the position to display on frontend.


